Real-world projects, multiple industries. Real analytics.
Each project started as raw source data and ended as reporting a real team could act on. Click any card for the breakdown: problem, approach, outcome, tools.
 Click to zoom
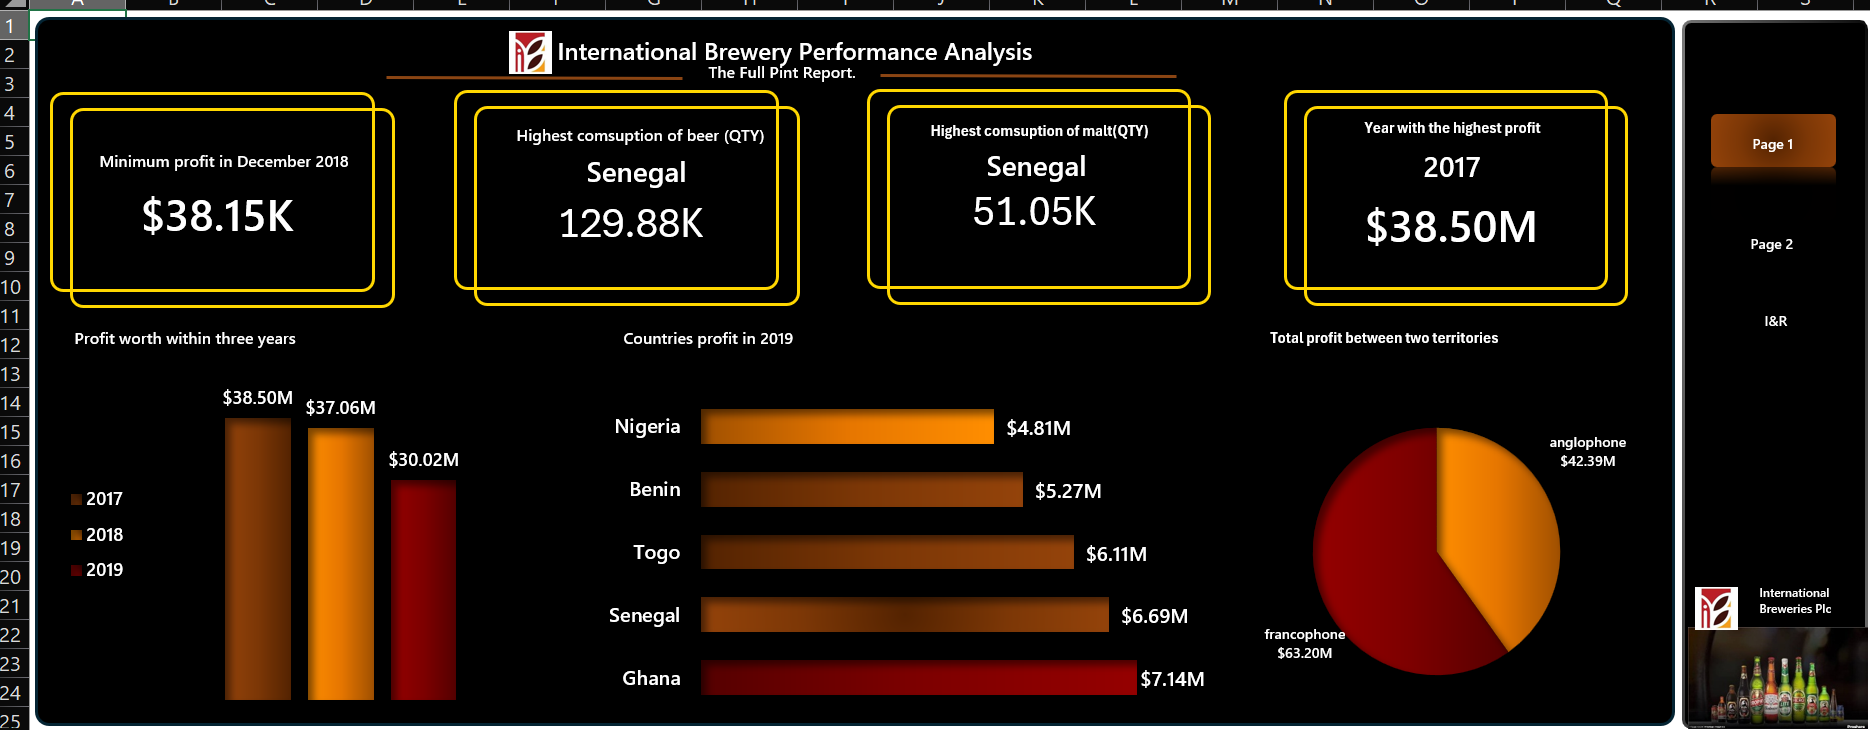
From Grain to Gain: An International Brewery Performance Analysis
A cross-country brewery performance report turning three years of sales, production and territory data into a single leadership view.
 Click to zoom
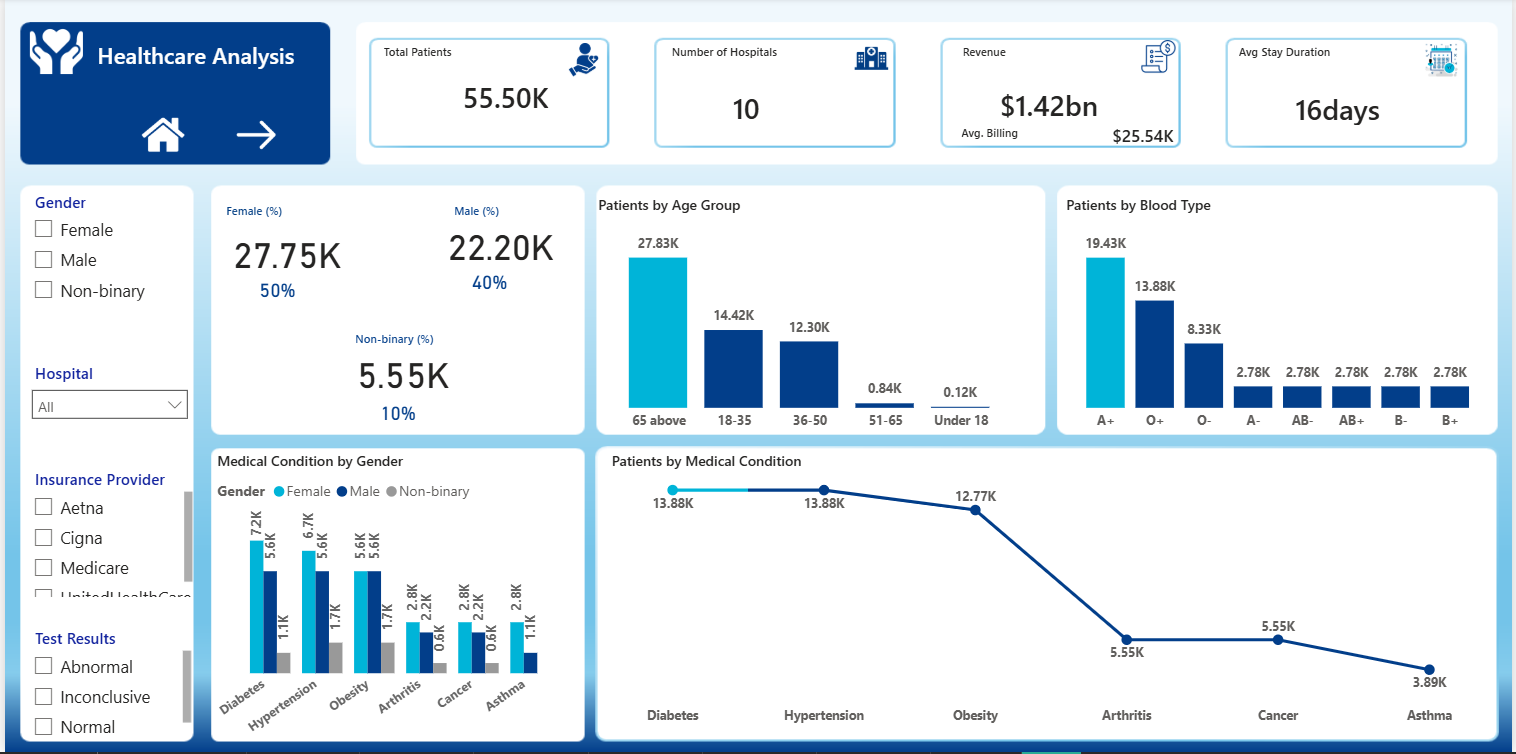
When Data Walks Into a Hospital: A Healthcare Story in Numbers
55,000+ patient records shaped into a Power BI healthcare report covering revenue, stay duration, demographics and medical conditions.
 Click to zoom
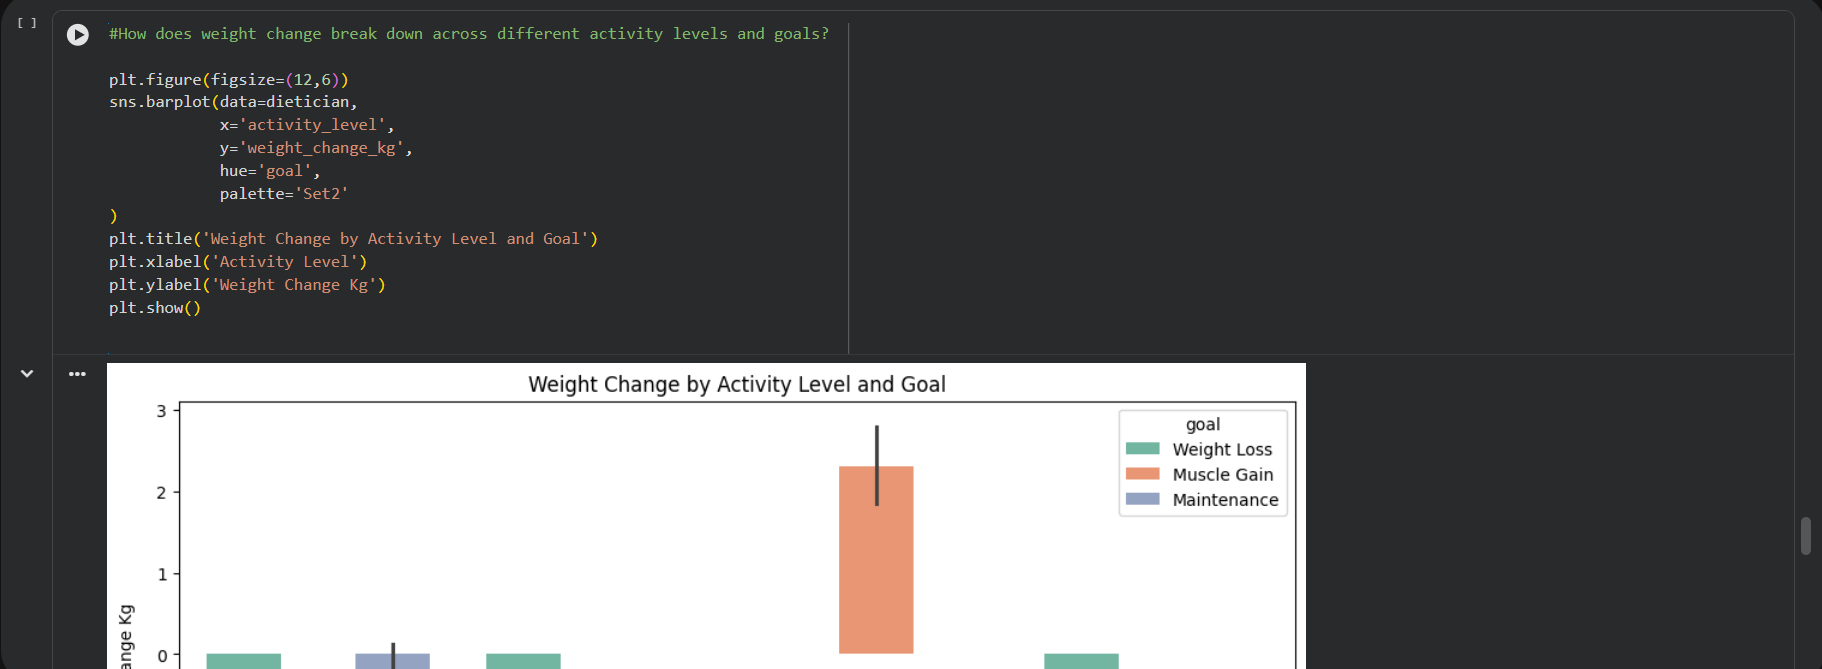
Dietician EDA: weight change across activity levels and goals
Python exploratory analysis of a dietician dataset, using pandas, seaborn and matplotlib to break weight change down by activity level and goal.
 Click to zoom
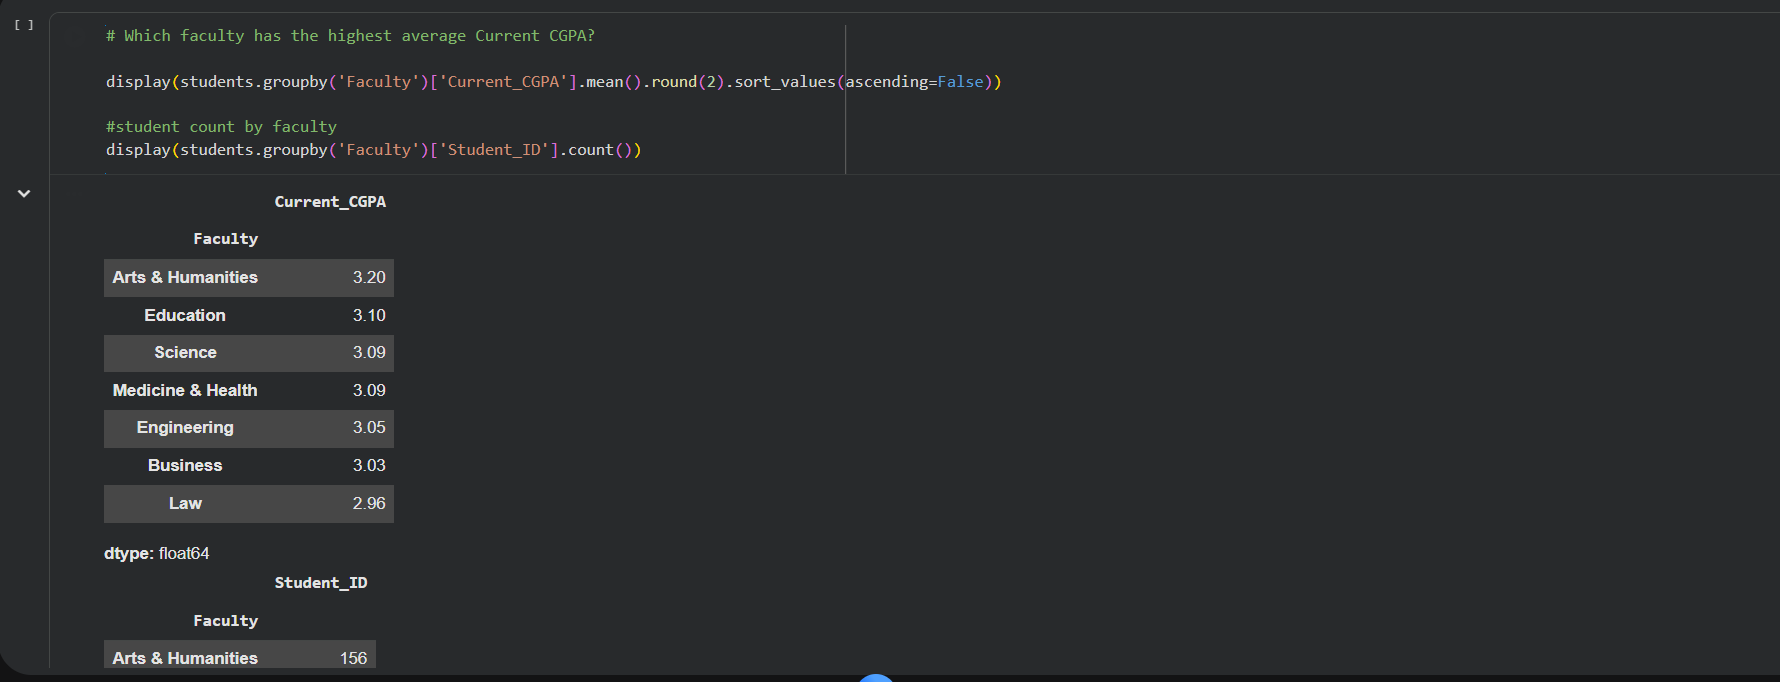
Student Performance EDA: CGPA and enrollment by faculty
Python EDA on a student dataset, using pandas group-bys to compare average CGPA and student counts across faculties.
 Click to zoom
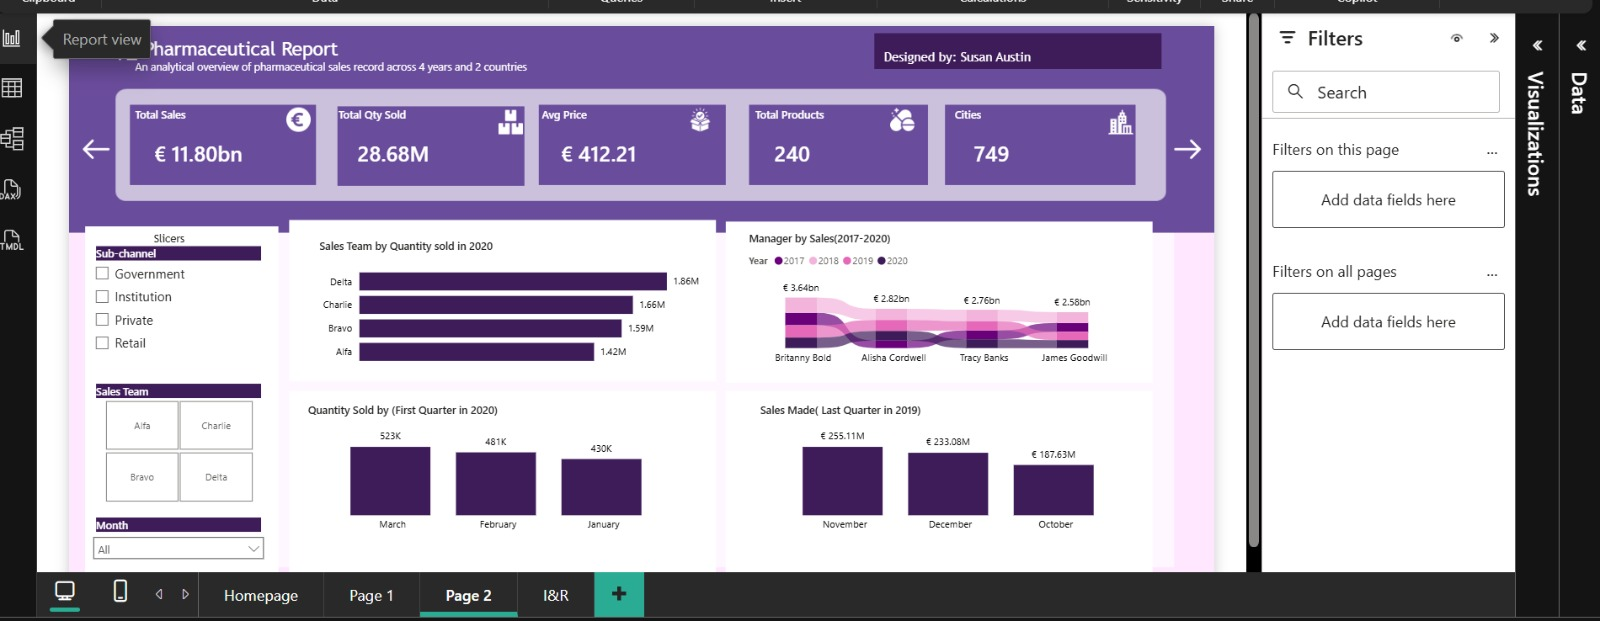
From Raw Numbers to a Pharmaceutical Report
Building a reporting layer leadership could actually act on, without sacrificing the rigor a regulated industry demands.
 Click to zoom
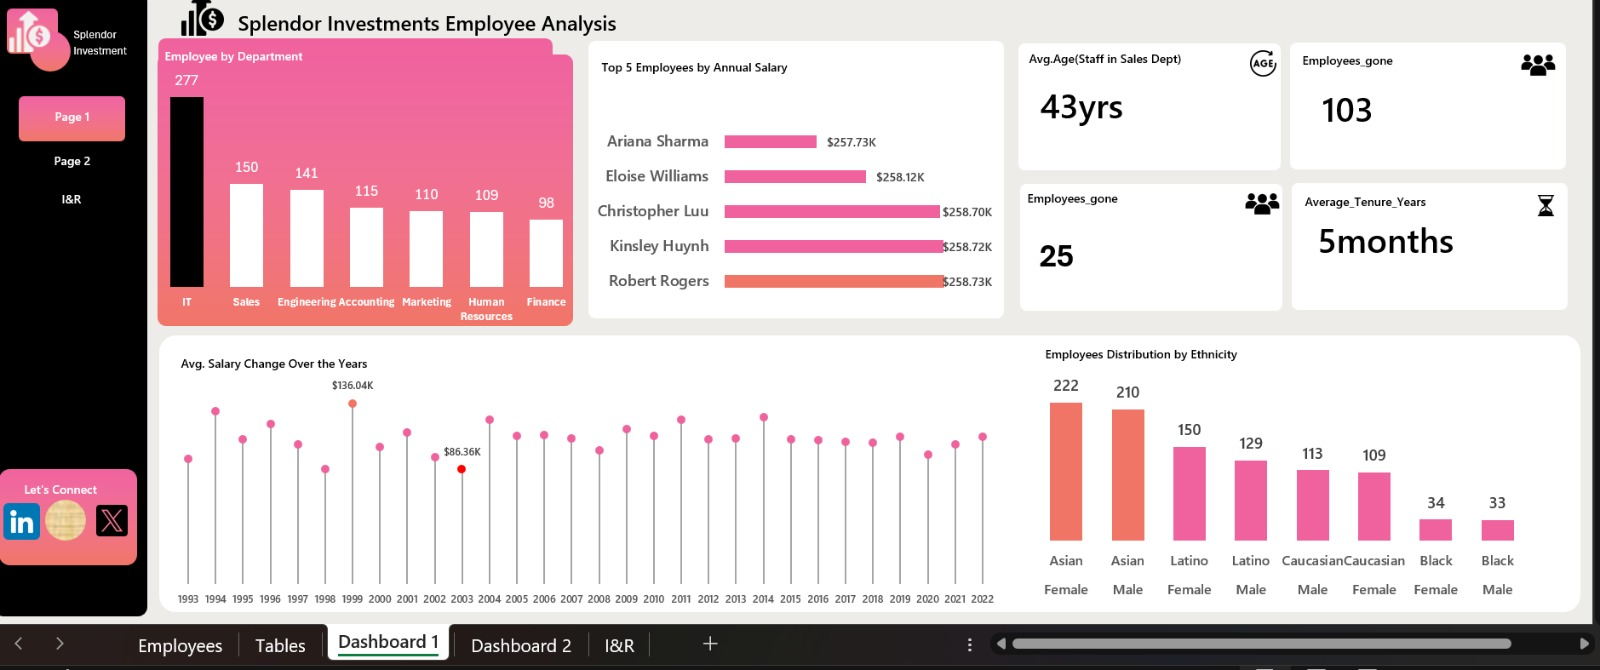
Inside Splendor Investments: what 1,000 employee records reveal
A people-analytics deep-dive into what a thousand employee records say about how a company is actually doing.
 Click to zoom
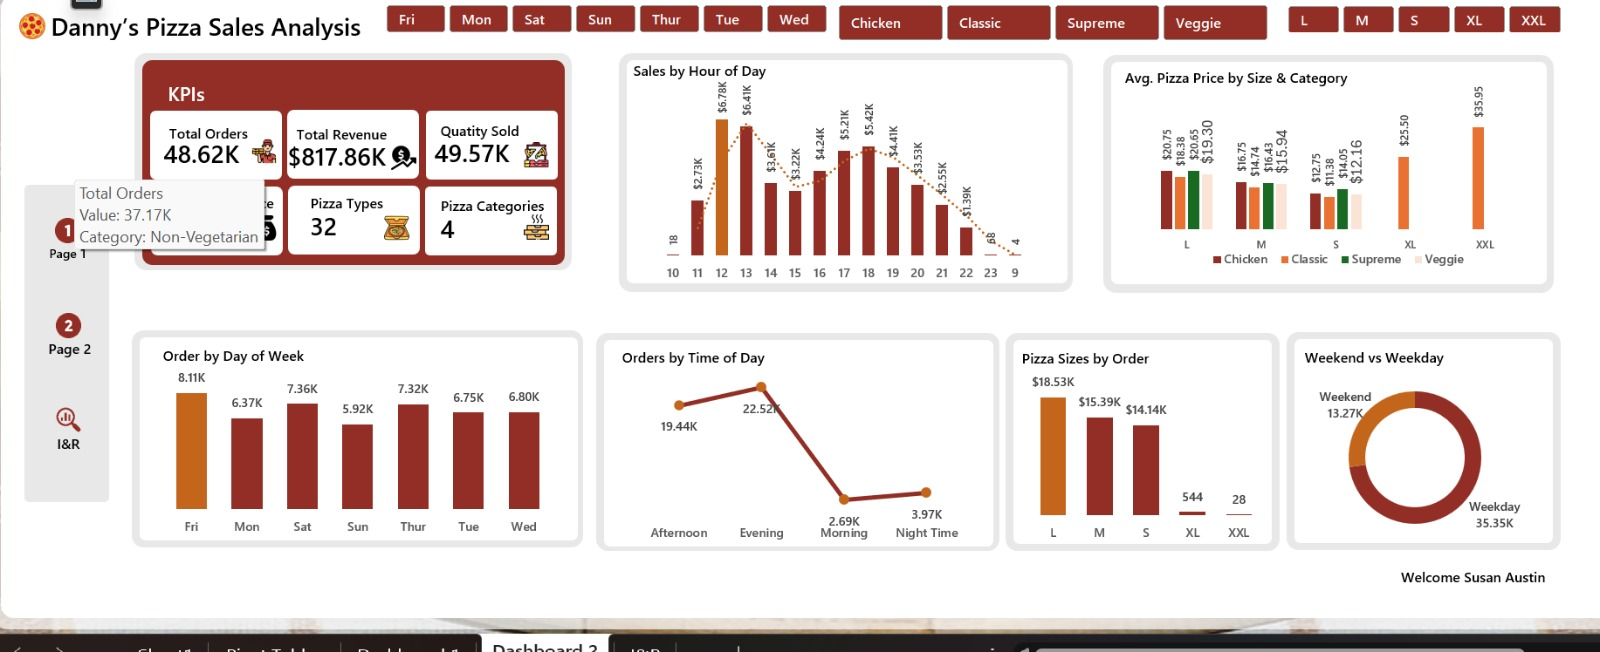
What 48,000 pizza orders taught me about customer behavior
48,000+ rows of order data, cleaned and aggregated in SQL to surface the products, times and order sizes that actually drive revenue.
 Click to zoom
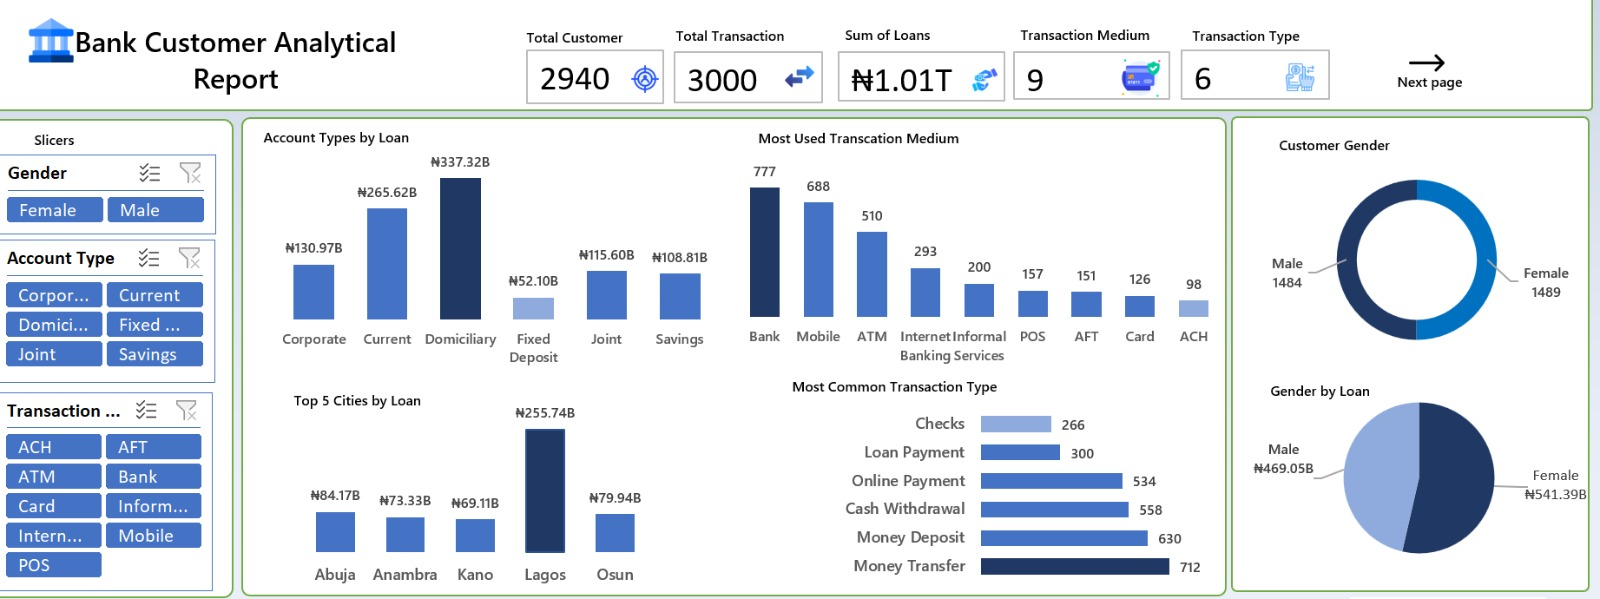
How I analyzed 3,000 bank customers
SQL-driven segmentation and Excel reporting on 3,000+ bank customer records, turning a flat table into a targeted retention playbook.